Figure 2. Panorama of the Millau Viaduct |
The Millau Viaduct, located in the west of the French city of Millau, is the world’s tallest vehicular bridge with one of the pylons' top rising up to 343 m above the river Tarn.
With 8 cable-stayed spans and a total length of 2’460 m it is also the longest cable-stayed bridge in the world |
This prestigious project won the 2006 IABSE (International Association for Bridge and Structural Engineering) Outstanding Structure Award.
The bridge is part of the new French highway A75, linking Clermont-Ferrand and Béziers and integrating a new connection between Eastern Spain and Northern Europe. |
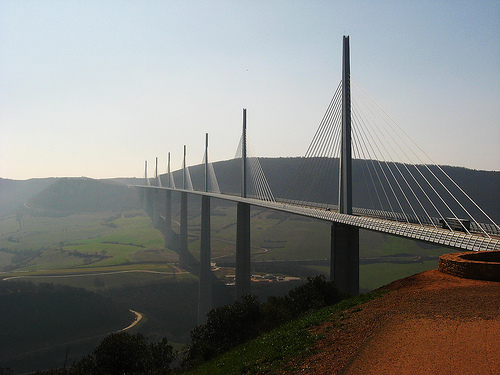
Figure 3. Impressions from the Millau Viaduct |
An Ambient Vibration Test was conducted by ViBest (Laboratory of Vibrations and Structural Monitoring) of FEUP (Faculty of Engineering of the University of Porto, Portugal), under the supervision of Professors Alvaro Cunha and Elsa Caetano. Contractor and coordinator of the bridge dynamic tests was CSTB (Scientific and Technical Centre of civil engineering, Dr. G. Grillaud and Dr. O. Flamand) Nantes, France.
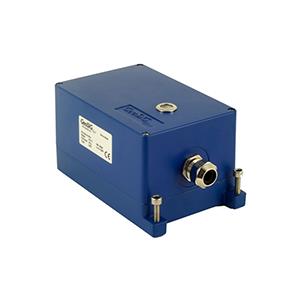
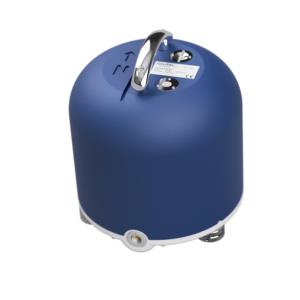
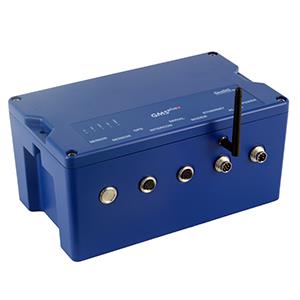
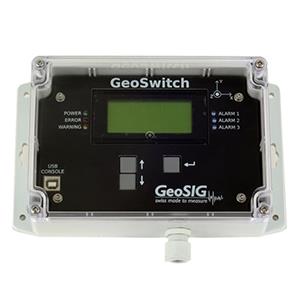
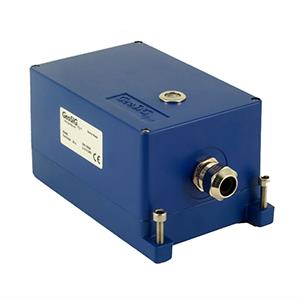
The test was developed complementarily using 4 GeoSIG GSR-18 Recorders with internal Accelerometer which were synchronised by GPS sensors. |
The Accelerographs were placed on top of the 32 m wide and 4.2 m deep deck, along the central line of the bridge.
The purpose of the test was to identify as many natural structural modes of the bridge as possible, essentially of vertical and transversal bending nature. With the chosen measurement point layout, torsional modes could not be identified.
Two of the previously mentioned Accelerographs were used as references, keeping them in fixed positions (R1 and R2 in Figure 4 below), whereas the other two were successively moved to one of the remaining 26 sections of the viaduct (Figure 4 below). |

Figure 4. Instrumented Sections of the Deck in the ambient vibration test (black solid squares indicate pylons) |
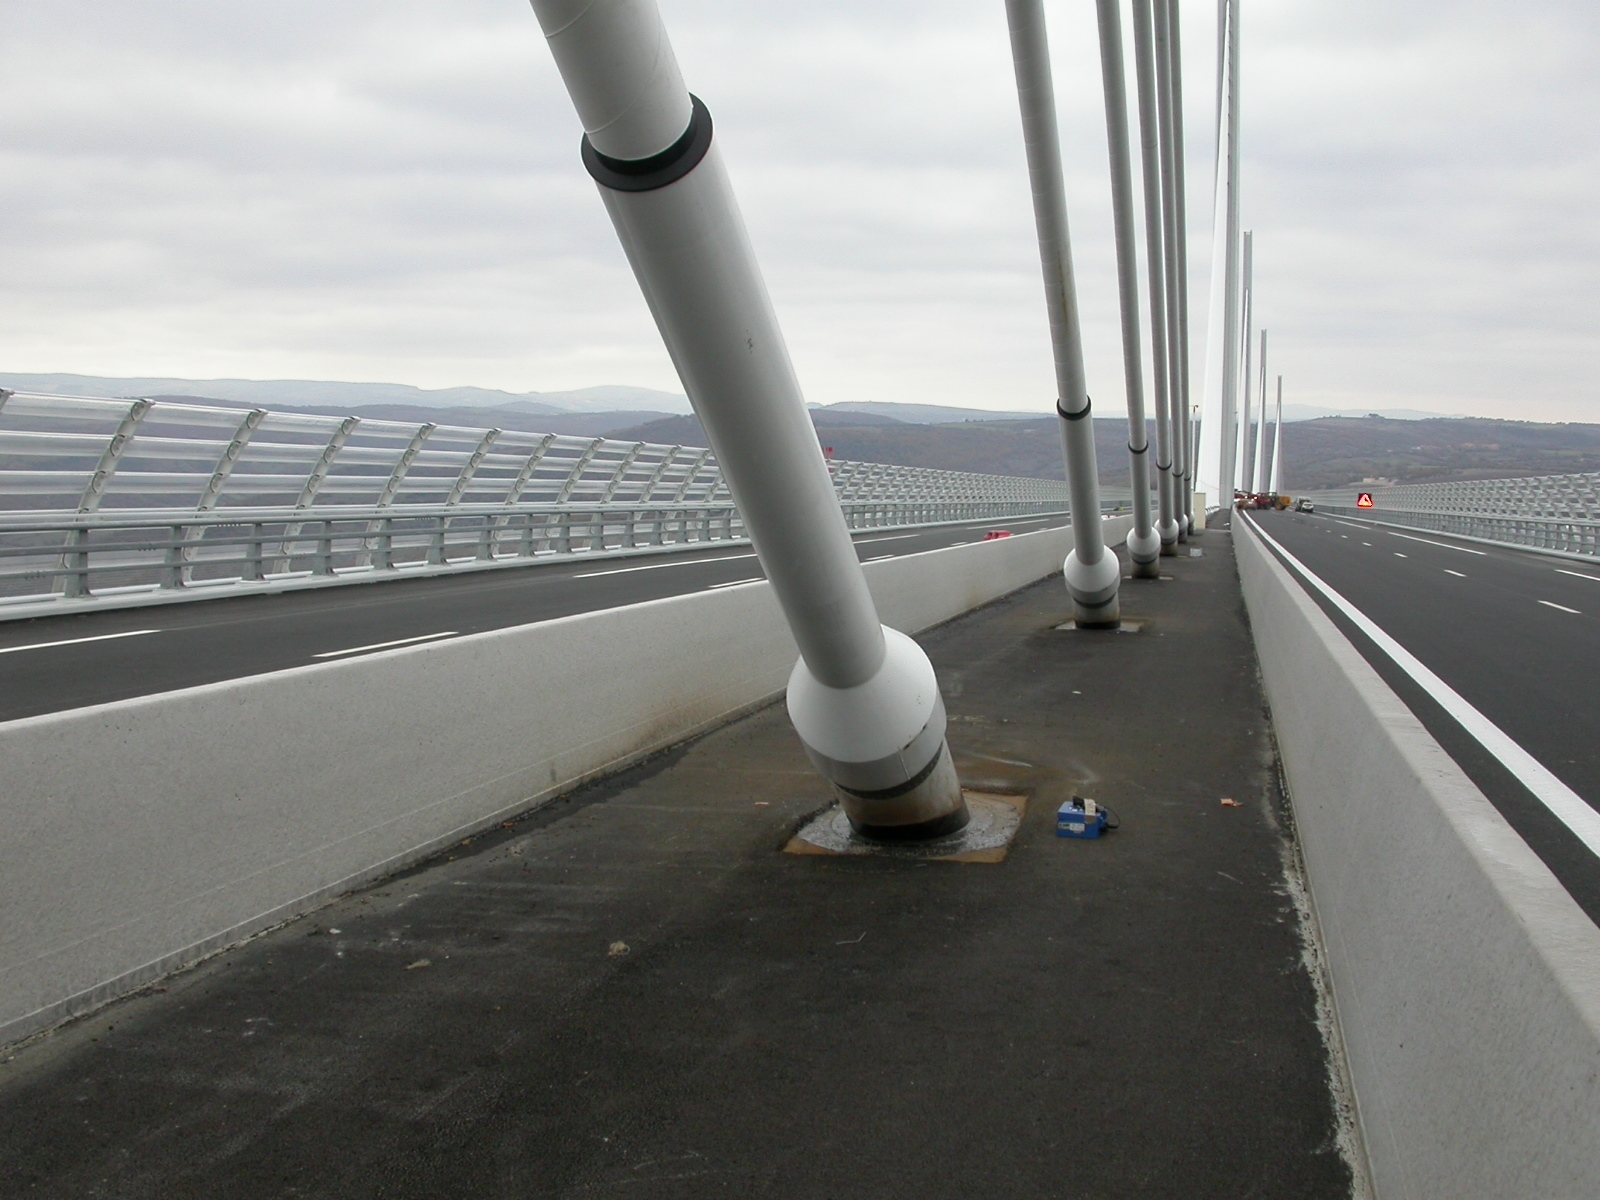 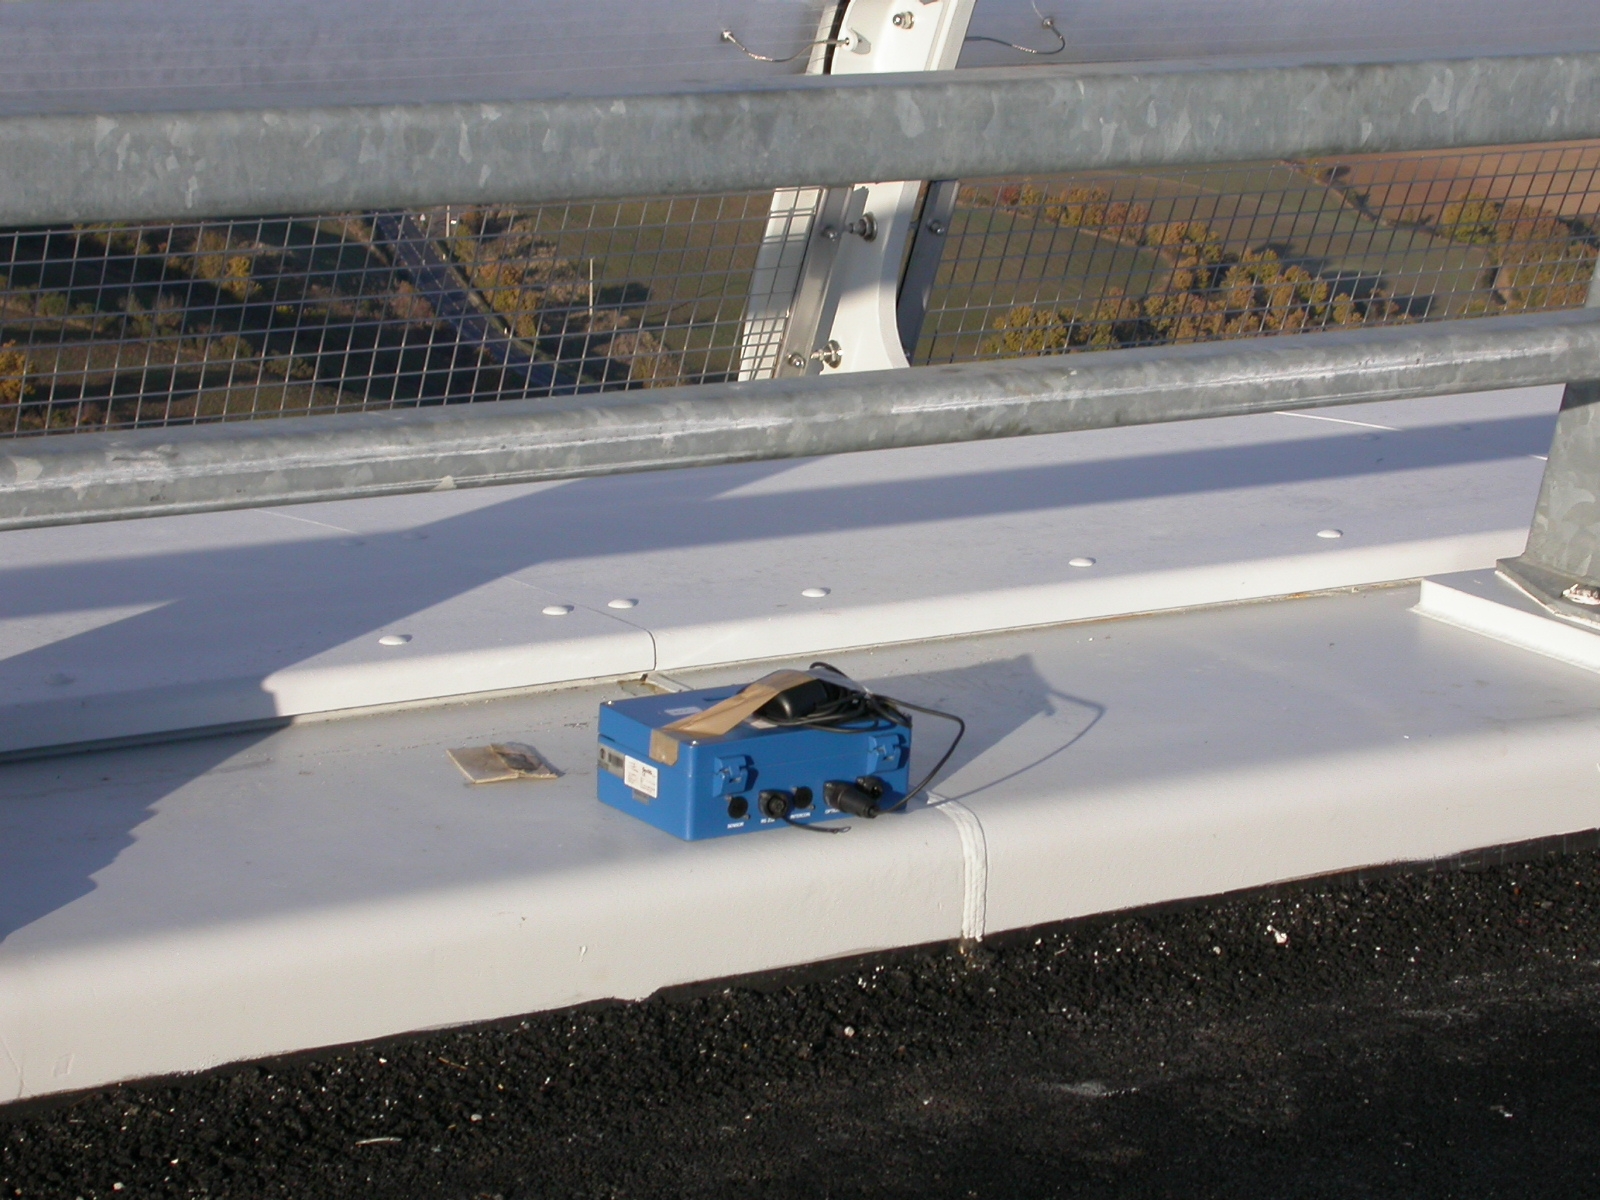
Figure 5. GeoSIG GSR-18 during the test |
| The Accelerographs were programmed using a laptop in order to acquire signals with a sampling rate of 100 Hz in periods of 960 seconds every 20 minutes, with the last 4 minutes being used to change the position of the two moving sensors for the following measurement setup. |
The test was completed in 7 hours and 30 minutes. During that period the wind speed was always very low and the traffic very sporadic, as the bridge had not yet been opened to traffic. These conditions were ideal for giving very accurate results which were used for the analytical reports. Some of the test results can be found below. |
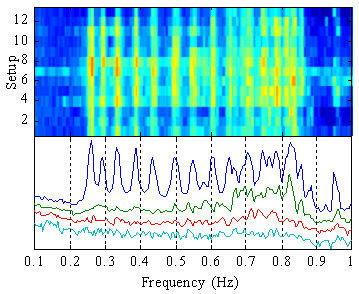 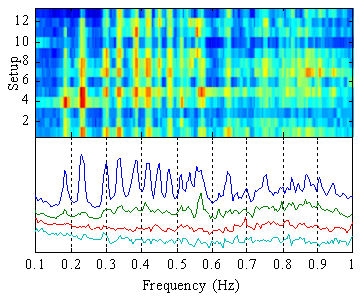
Figure 6. Average singular values of the spectra matrices and colour maps with variation of 1st singular values during the test
(Vertical direction on the left, lateral direction on the right) |
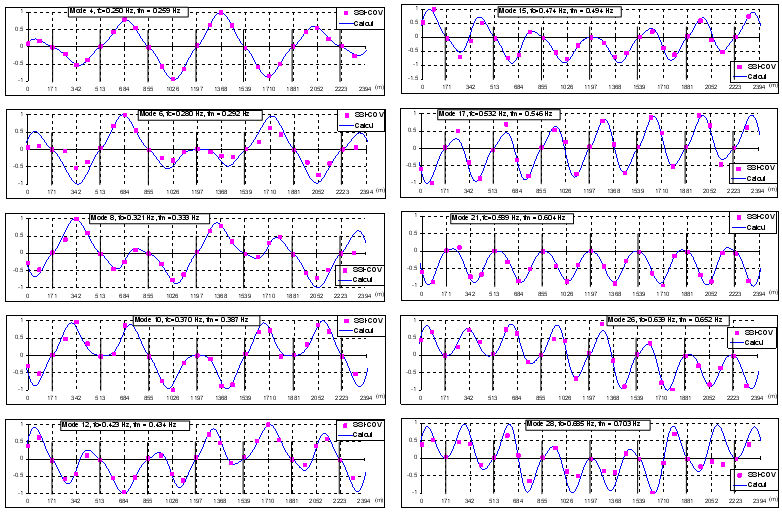
Figure 7. Vertical bending modes range 0.2 – 0.7 Hz: identified vs calculated modal components |
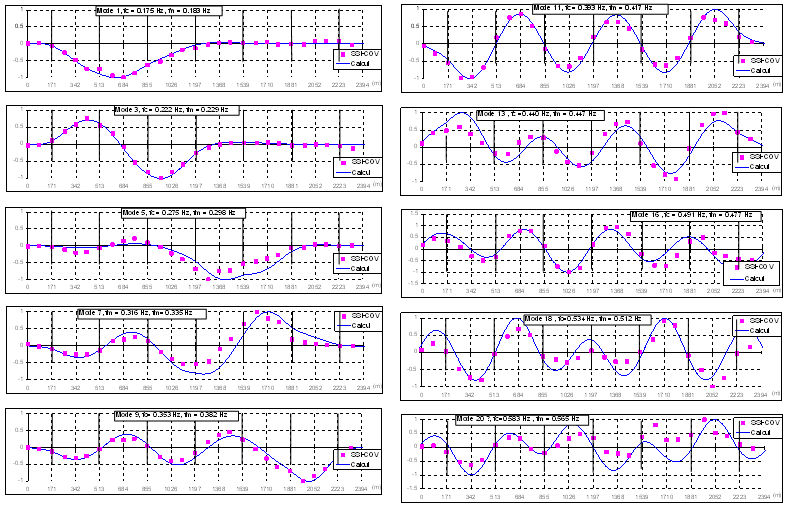
Figure 8. Transversal bending modes range 0.1 – 0.6 Hz: identified vs calculated modal components |
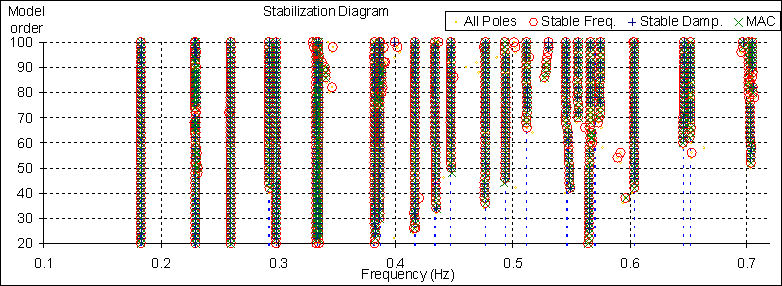
Figure 9. Stabilization diagram |
| We would like to take the opportunity to thank Prof. Alvaro Cunha for his close collaboration regarding this article. |
The source paper to above mentioned article can be viewed here. |


