


GeoSIG GeoSMART
Key Features
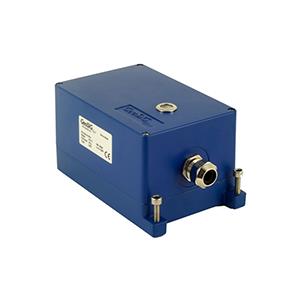
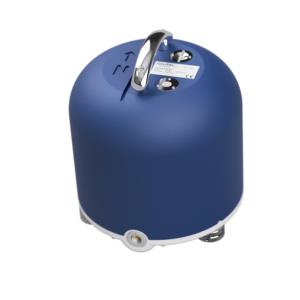
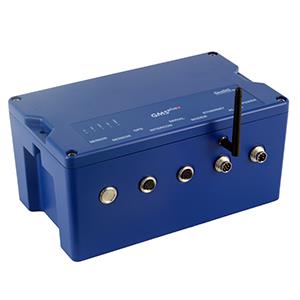
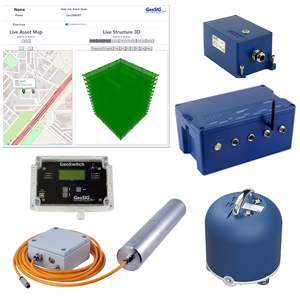
The main features of GeoSMART can be summarised as follows:- Support for any type of sensor such as acceleration, velocity, displacement, tilt, wind, temperature, strain, and many more.
- User-friendly web-interface for an intuitive experience.
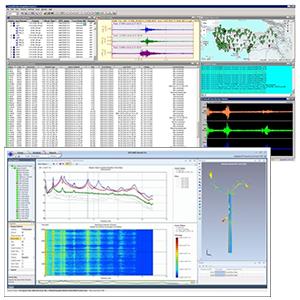
- 3D representation of any structure with live status.
- Interactive zoom, rotate, pan, visibility and projection.
- Multiple structures on live interactive map.
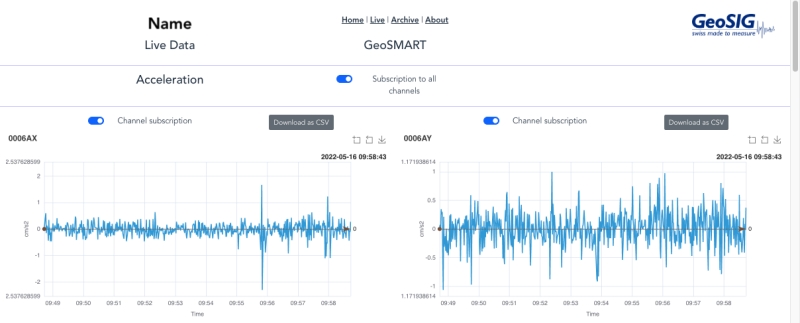
- Real-time continuous data acquisition and processing.
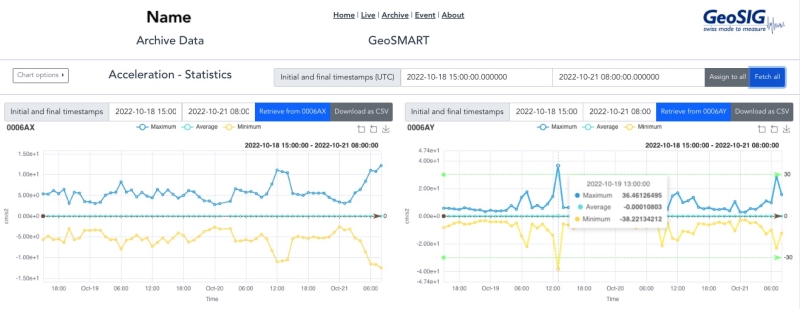
- Storage and direct download of all data and graphics.
- Data export for long-term storage.
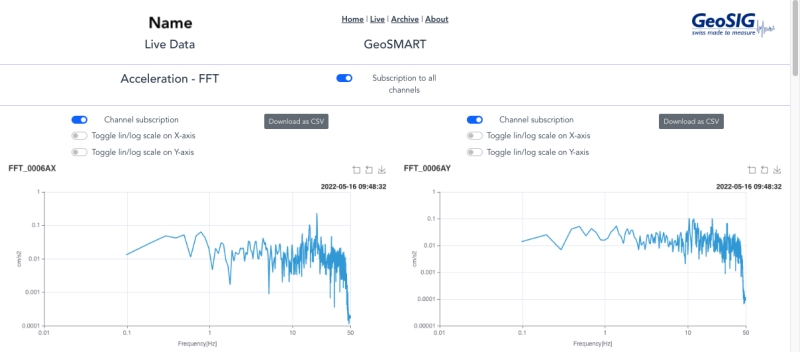
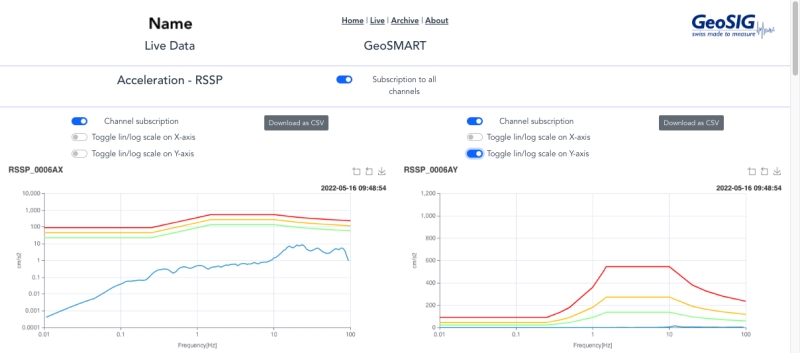
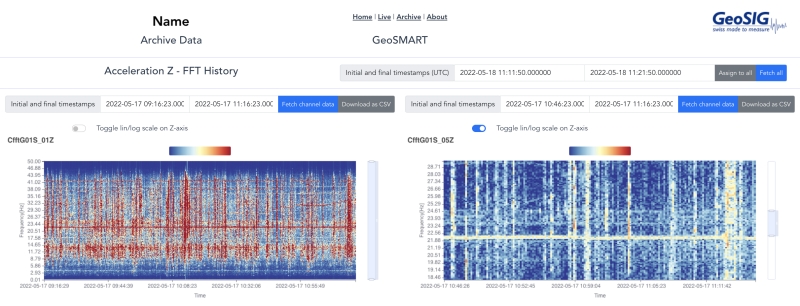
- Sliding window-based continuous frequency analyses: Amplitude, Spectrogram and Response Spectra.
- Rigid body motions in translations and rotations.
- Interpolations for non-instrumented areas.
- Interstory drift ratios and torsion.
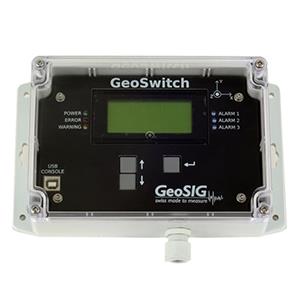
- Exceedance of predefined threshold levels or curves.
- Plot of archive data and statistical information.
- Live screen indicators and HTML formatted emails.
- Individualised notifications to users / user groups.
- Customisable messages such as action plans.
- Reports including actual images of plotted graphics.
- Hardware relays to start or shutdown any process.
- Advanced user accessible powerful database to fetch and externally manipulate the stored data.
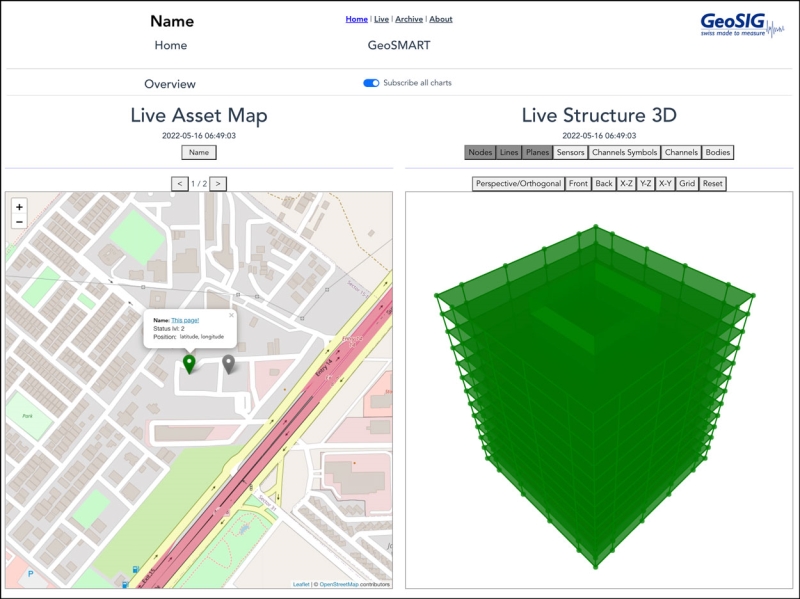
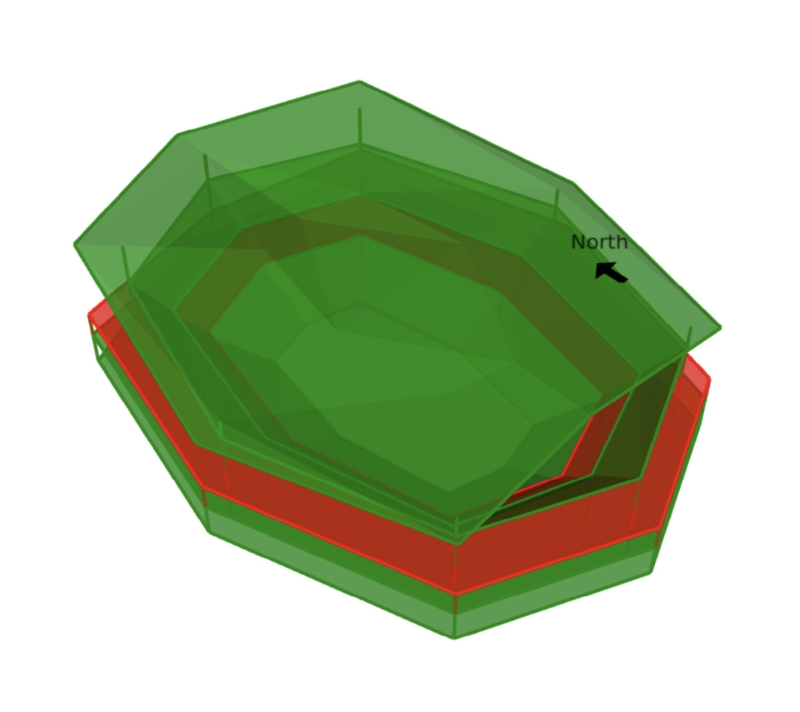
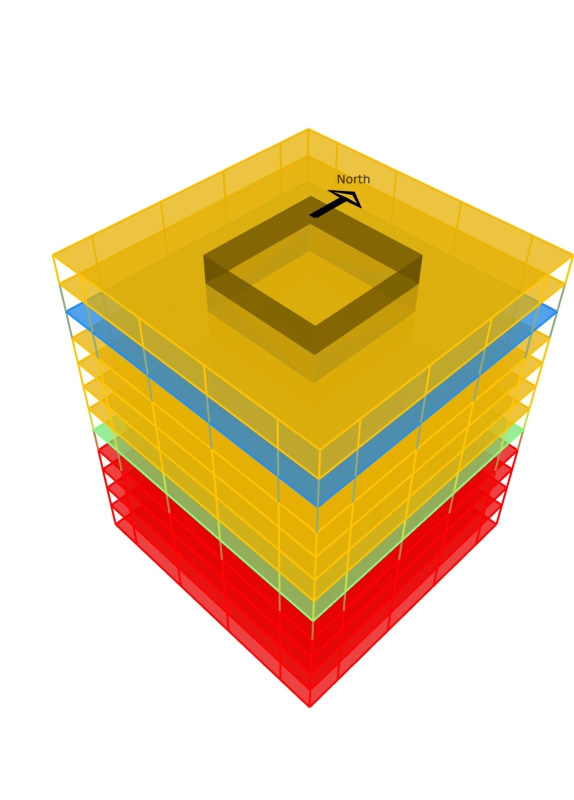
GeoSMART is an innovative graphical application that provides tools for realtime structural health monitoring for civil engineering structures. GeoSMART, with its “smart” features, can monitor and display the status of a structure that is equipped with GeoSIG measuring instruments. GeoSMART is S2HM in a Box; it has been designed to meet fundamental engineering requirements with respect to structural health monitoring applications.
Manual available on request only.
Manual available on request only.